
Executive Summary
Dynamic light scattering (DLS) is an analytical technique used to measure the particle size distribution of protein formulations across the oligomer and sub-micron size ranges of approximately 1 nm to 1 µm. The popularity of DLS within the biopharmaceutical industry is a consequence of its wide working size and extended sample concentration ranges, as well as its low volume requirements. With that said, the challenge that remains with the application of DLS to protein therapeutic formulations is centered around data interpretation. In this four-part white paper series, common issues and questions surrounding the principles, measurements and analysis of DLS data are discussed in order to help minimize the time required for and complexity of acquiring and interpreting DLS data that is critical throughout the development process. In this third white paper of the series, we cover the basic types of DLS deconvolution algorithms used to extract the intensity weighted particle size distribution from the measured correlogram.Dynamic Light Scattering
Dynamic light scattering (DLS) is an analytical technique used within bioapplications to measure particle size distributions across the oligomer and sub-micron size ranges. In a DLS measurement, scattering intensity fluctuations are correlated across small time spans, yielding a correlogram. The distribution of particle diffusion coefficients is extracted from the measured correlogram using various deconvolution algorithms, each of which can yield different results. Identifying the proper algorithm, and hence the correct distribution of diffusion coefficients, requires a basic understanding of the operational limitations of the algorithm.
DLS Correlogram
For particles in solution moving under the influence of Brownian motion, the measured scattering intensity will fluctuate with time, producing an intensity trace which appears to represent random fluctuations about a mean value. The signal fluctuation rate will depend upon the rate of change of the position of the particles, with slow moving particles leading to slow fluctuations and fast moving particles leading to fast fluctuations.
Correlation is a 2nd order statistical technique for measuring the degree of non-randomness in an apparently random data set. When applied to a time-dependent intensity trace, the intensity correlation coefficients, G2(τ), are calculated as shown below, where τ is the delay time and the 2 subscript in G2 indicates the intensity rather than the field autocorrelation.

For direct application, the correlation equation can be expressed as the summation shown below and detailed in Figure 1.
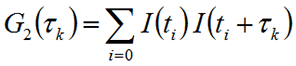
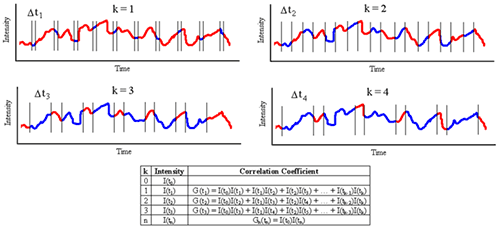
Figure 1: Schematic detailing measurement and construction of the DLS correlogram. Typically, the correlation coefficients are normalized, such that G2(∞) = 1. For monochromatic laser light, this normalization imposes an upper correlation curve limit of 2 for G2(τ0) and a lower baseline limit of 1 for G2(∞). In practice, the theoretical upper limit can only be achieved in carefully optimized optical systems. Typical experimental upper limits are around 1.8 to 1.9 for G2 or 0.8 to 0.9 for G2 - 1, which is what is usually displayed in DLS correlogram figures (Figure 2).
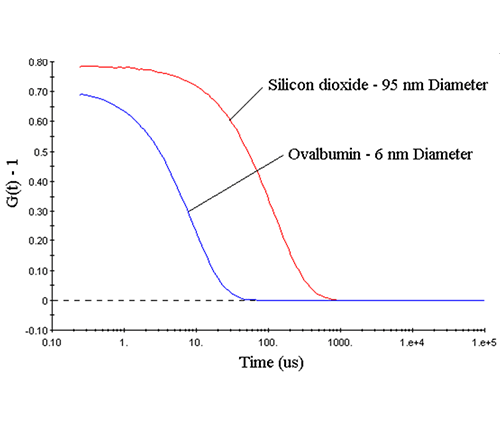
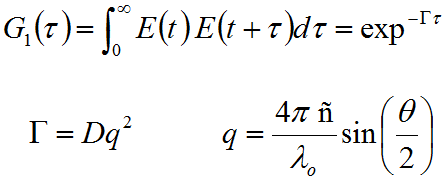
Figure 2: DLS measured correlograms for 6 nm ovalbumin and 95 nm silicon dioxide in PBS. Deconvolution The scattering intensity fluctuations measured during a DLS experiment are a manifestation of fluctuations in the electric field generated by the ensemble collection of solution particles. The electric field fluctuations are a consequence of the superposition of fields (or waves) generated by each of the scattering particles as they diffuse through the solution. So information regarding particle motion is contained within the electric field function, as indicated in the field autocorrelation expression (G1) given below, where E is the field function, Γ is the decay rate, D is the mean diffusion coefficient, q is the scattering vector, λ0 is the vacuum laser wavelength, ñ is the medium refractive index, θ is the scattering angle, and the 1 subscript in G1 indicates the field autocorrelation.
The intensity, which is the actual parameter measured in a light scattering experiment, is equivalent to the square of the field (I = E2), with the respective autocorrelation functions related to each other through the Seigert relationship, where γ is a coherence factor expressing the efficiency of the photon collection system.

So the Seigert relationship can be used to deconvolute particle motion information from the DLS measured intensity autocorrelation function.
Download the full Application Note as PDF
Malvern Instruments provides the materials and biophysical characterization technology and expertise that enable scientists and engineers to understand and control the properties of dispersed systems. These systems range from proteins and polymers in solution, particle and nanoparticle suspensions and emulsions, through to sprays and aerosols, industrial bulk powders and high concentration slurries. Used at all stages of research, development and manufacturing, Malvern’s materials characterization instruments provide critical information that helps accelerate research and product development, enhance and maintain product quality and optimize process efficiency. Our products reflect Malvern’s drive to exploit the latest technological innovations and our commitment to maximizing the potential of established techniques. They are used by both industry and academia, in sectors ranging from pharmaceuticals and biopharmaceuticals to bulk chemicals, cement, plastics and polymers, energy and the environment. Malvern systems are used to measure particle size, particle shape, zeta potential, protein charge, molecular weight, mass, size and conformation, rheological properties and for chemical identification, advancing the understanding of dispersed systems across many different industries and applications. Headquartered in Malvern, UK, Malvern Instruments has subsidiary organizations in all major European markets, North America, Mexico, China, Japan and Korea, a joint venture in India, a global distributor network and applications laboratories around the world. www.malvern.com severine.michel@malvern.com

Newsletters
Receive the latest pharmaceutical news, personalities, education, and career development – weekly to your inbox.