Time to Dive into Design of Experiments
Data, data everywhere... But pharma is not making the most out of it. Multivariate statistical modeling can play a key role in Quality by Design. Here’s how.
Jasmine |
Over the last few years, medicine users have seen an upsurge in news about pharmaceutical quality complaints, including shortages of essential and life-saving drugs, safety and efficacy cases, and market recalls for extraneous matter. No doubt all of us involved in developing and manufacturing products in the industry have our own tales of woe: late approvals, out of specification (OOSs), out of trend (OOTs) results, repeat corrective and preventive action, issues with scale up or analytical method transfer, sampling errors, shelf life issues... The list of potential problems goes on.
Quality by Design (QbD) has been hailed as a panacea for all these troubles. I am an advocate of QbD and believe this claim is not too far from the truth. After all, most quality issues are inadvertently designed into products. With a good design strategy, it is possible to minimize the possibility of quality issues ever arising during a product’s lifecycle.
In my last article for The Medicine Maker, I discussed the use of Design for Six Sigma (DFSS) tools for QbD-based product development (1). The article described Six Sigma as a data-driven approach to making more effective decisions for better quality products. The conversion of data into information is brought about by statistics – and DFSS involves a number of statistical tools too. Statistical tools help make data-driven decisions – decisions that do not rely on hierarchy, emotions or politics. The most common area for the use of statistics in pharma is limited to the clinical space where the number of patients enrolled, power of studies and hypothesis testing are everyday topics. Outside of the clinical and bioequivalence areas, the full potential of statistical methods has not been realized.
For this article – my third in this series for The Medicine Maker – it’s time to discover how QbD and statistics can help to avoid quality problems.
Modeling data: a lucrative target
Why is it important to model data in pharmaceutical product development? Scientists in pharmaceutical laboratories perform experiments every day to validate scientific hypothesis – not just to generate data, but rather to create information and make predictions. In the current environment, industries are increasingly operating in tighter economic conditions, which means they are on the lookout for operational efficiencies anywhere and everywhere, including in R&D. At the same time, vast amounts of data are available and growing exponentially year on year. But without a structure or business context to give data meaning, most information resources remain largely untapped because of lack of in-depth and relevant analysis. It is a huge waste of a very valuable resource, particularly in a competitive business environment, which is where data models come in (2). In fact, the pharma industry generates so much data that it is potentially a lucrative target for big data analytics, which could help make R&D faster and more efficient, and also help develop adaptable clinical trials and improve safety and risk management for patients and businesses (3).
But let’s handle this one step at a time and start with small data first. Here is a very simple illustration of the motivation to model. Let’s assume a few experimental runs yield data of values of response variable (Y) at certain conditions of an influencing factor (X):
| X | Y |
| 38 | 75 |
| 36 | 72 |
| 32 | 85 |
| 31 | 82 |
These four data points show what happens to Y at values of X. A model, on the other hand tells us, with a known level of confidence, what happens to Y at every data point in the range of Xs studied. You don’t just know what happens to Y at X= 31, 32, 36 and 38 – you know everything that happens to Y in the entire range. A simple model for this data looks like:
Y = 131.3 - 1.542 X.
Our little model is now like a genie. Let’s say that Y is a particle size distribution (PSD) result and X is a crystallization parameter – the genie tells you based on your customer requirement of particle size how your crystallization process should be optimally performed to keep your customer happy. In pharmaceutical parlance, models help build relationships between critical process parameters (CPPs) and critical material attributes (CMAs), as well as what is critical to the patient – critical quality attributes (CQAs). These modeled relationships help establish design spaces and operating ranges for reliable product manufacturing. It is very important to note that in the absence of models, any decision on processing parameters and material attributes can be very short sighted, subjective and prone to biases introduced by different entities involved in the data generation and analysis. Judgement based on limited evidence also has a low probability of being successfully reproduced at scale. I’ve even seen occasions where something cannot be reproduced in the same lab again. Processes developed purely by the OFAT (one factor at a time) approach are examples of such risky processes.
The model maker
Scientists and engineers learn both pure and applied sciences primarily based on deterministic models. While these models help build our first association with building relationships between a set of factors and responses, they almost always rely on the premise that nature sits idle when processes happen. Remember the ideal gas equation PV=nRT? This is a deterministic model, but we all know that variation is nature’s only irreducible evidence (4).
Stochastic models are statistical models that take into account randomness and can predict with a greater level of accuracy what may happen tomorrow. There are also “hybrid” models that build stochastic elements into deterministic models. Figure 1 illustrates the difference between deterministic versus stochastic modeling – stochastic models are best and most economically built from a set of designed experiments (DoE). The premise of QbD-based product development is to be able to predict real-world relationships between inputs and outputs – reproducibly. Statistical models help us with “real world” and “reproducibly.”
DoE first began with the optimization of a potato crop field based on irrigation pattern, choice of seeding pattern and nutrient ratio. If the unfortunately common practice of OFAT had been employed by Ronald Fisher, who is considered the father of DoE, who knows how long it would have taken Great Britain to become great enough to feed all of its war-ravaged hungry citizens again... DoE was born out of minimum resources to get maximum information.
I wrote about DoE in my second article on design for Six Sigma (DFSS) based QbD development. DoE is a part of the “design” phase in the DMADV (define, measure, analyze, design, verify) cycle. Although invented in a potato field, it was popularized in pharma’s allied industry – fine chemicals – with companies like ICI and DuPont taking the lead. ICI and Du Pont gave DoE greater structure, including the three-step approach to explaining chemistry – screening, characterization and optimization.
When designing agricultural field trials, Fisher said, “No aphorism is more frequently repeated in connection with field trials, than that we must ask Nature few questions, or, ideally, one question, at a time. The writer is convinced that this view is wholly mistaken.” Nature, Fisher suggested, will best respond to “a logical and carefully thought out questionnaire” (5). Such a questionnaire is a DoE, which allows the effect of several factors – and even interactions between them – to be determined with the same number of trials as are necessary to determine any one of the effects by itself, with the same degree of accuracy. There are many reasons to choose DoE:
- Interactions: DoE explores the “real world” relationships between factors and responses – not just one at a time, but in a true multivariate way because it also explores interactions between parameters to yield rare responses. Interactions happen all the time in the real world. I personally once saw an advanced API intermediate, which behaved absolutely normally when tested for hygroscopicity and photo degradation (one at a time), turn from white to almost bright orange when subject to humidity and light together.
- Less experiments: There can almost be no comparison between resources required to obtain the same amount of understanding between OFAT and DoE. DoEs are built on principles from geometry, not just statistics, and are the most efficient way of gaining maximum understanding of a multivariate environment. Often, scientists work on complex pharmaceutical products and multi-step processes where no scientific theory or principles are directly applicable or applicable alone. Experimental design techniques become extremely important in such situations to develop new products and processes in a cost-effective and confident manner.
- Competing CQAs: It’s not just the hunt for interactions in minimal experiments that make DoE lucrative to explain the “real world”. More often than not, pharmaceutical products are characterized by multiple CQAs, each with different relationships with CPPs and CMAs. These CQAs sometimes compete in different directions for the optimal setting. As an example, while a higher temperature in a reaction may increase the impurity profile and hence reduce the safety of an API, it may also be important to achieve the desired polymorph content for the right therapeutic benefit. Such situations are also easily designed around using desirability profiling in DoEs and generating “sweet spots”.
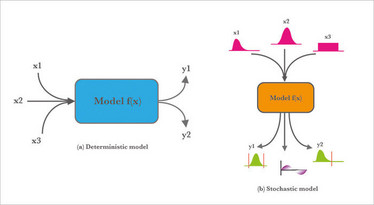
Figure 1. A simple illustration of a deterministic model (a) and a stochastic model (b) process – adapted from bit.ly/2hl2b1L.
- Building robust processes: DoE finds relationships and makes predictions “reproducibly”. Statistical models split the information from experiments into “signal” and “noise” – by doing this, they help us assess the true probability of an outcome versus a random event. Dig a little deeper and they will even be able to tell you which factor settings will give you a certain prediction interval (PI) of responses. PIs as opposed to point estimates can tell you what factor settings yield a certain response – not just once, but the probability of finding a response with an assumed confidence level and assumed number of times. Remember process capability indices like Cpk and Ppk? DoEs build these metrics into your process design.
How to DoE it!
DoEs begin in a cross-functional risk assessment evaluating the CQAs. Fishbone diagrams are commonly employed here to look at how Men, Machine, Measurement, Methods and Milieu affect the CQAs. Risk assessment tools, such as like Risk Priority Numbers, are used to select the critical few influencing factors for multivariate experimentation. Experimental ranges of these factors are then established from prior knowledge and experimentation. The objective of further experimentation (screening or optimization) is then decided, followed by selection of a DoE layout.
Screening DoEs are used to pick the “vital few factors from amongst the trivial many” as suggested by the Pareto Principle which was popularized by the QbD guru – Joseph M Juran. As an example, the titer obtained from a fermentation process can be influenced by molecular biology parameters, media recipe, and processing parameters, such as agitation, pH and temperature. Screening DoE, such as Plackett-Burman designs, fractional factorial designs and optimal designs, help identify which of these many factors have the strongest influence on titer. A screening DoE separates the many possible influences on a CQA into those that need to be studied the most to be able to best control the response. In the example of a fermentation process described above, the pH profile and media recipe maybe much more critical than the other factors studied earlier.
Characterization and Optimization DoEs, such as factorial designs, response surface modeling (RSM) and optimal designs, are then used to tune those key influencing factors to reach the target value of the response. These DoEs yield models with a high level of predictability over the experimental space. To optimize the fermentation process, a part of the pH profile and media recipe range studied in screening may be looked at more closely in optimization to establish a robust operating space.
Figure 2 shows the pharmaceutical QbD roadmap. Consider the step, “design space”. This term, borrowed from the aerospace industry, means “design on earth what will happen in space”. Given that our pharmaceutical products rarely go into space, design space for pharmaceutical product development scientists means design in R&D, keeping all possible things that happen in manufacturing, such as at different scales, and with different equipment, operators, raw material suppliers and analytical methods, in mind. Such process capability can be built into the product using DoE. Another form of DoE called evolutionary operations (EVOP) when used in manufacturing helps build the “continuous improvement” step in the same pharmaceutical QbD roadmap.
Without DoE, we would probably never make design spaces. If you test factors one at a time, there’s a very low probability that you’re going to hit the right one before everybody gets sick of it and quits! (6). (As a side note, it would also be very difficult to make cool and colorful contour plots, such as the one in Figure 3, which are all the rage in regulatory circles these days.)
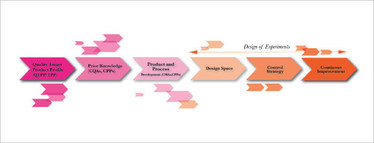
Figure 2. Pharmaceutical Quality by Design roadmap of experiments.
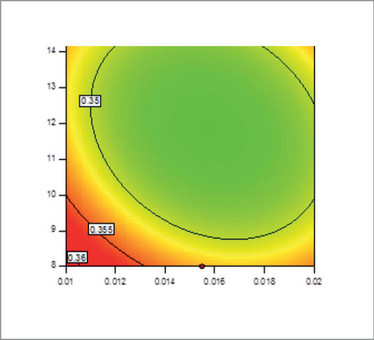
Figure 3. An illustration of a contour plot. A contour plot is easier to interpret than a 3D surface plot.
Sound science
A new advertisement by JMP, a statistical software for process development, says very relevantly, “Luck is Good, JMP is Better”. Software, such as JMP, Minitab and Design Expert, have progressively made statistics easy to learn and use for the scientist. Statistics is also steadily finding its way into scientific curriculum. Progressive computing capabilities are making DoEs even more efficient and predictable. Sound science coupled with sound statistics in the form of DoEs has the unique ability to make better pharmaceutical products – which aren’t plagued by OOSs, OOTs, analytical method variability, recalls and rejects that dampen the industry’s morale and erode patient confidence in pharma products.
A while ago, I read an article in a Forbes magazine from 1996 about DoE (which the article referred to as “multivariate testing”) (6). The article made a very compelling case to use DoE for increasing sales of movie theatres through free popcorn and to improve touch screens for ATM machines by changing the type of polyester and adhesive used. The article also said that OFAT became outdated more than seventy years ago, but it has taken an extraordinarily long time to trickle down...
Twenty years later, and it’s still just trickling down into the pharmaceutical industry. To drive QbD to its logical end, let’s turn this trickle into a downpour!
Jasmine is Principal Scientist, Quality by Design, at Dr. Reddy’s Laboratories SA. The views expressed are personal and do not necessarily reflect those of Jasmine’s employer or any other organization with which she is affiliated.
- Jasmine, “Building a QbD Masterpiece with Six Sigma,” The Medicine Maker, 21 (2016). Available at: bit.ly/2fRk7j8.
- IBM Big Data and Analytics Hub, “Why Organizations Can’t Afford Not to Have a Data Model”, (2012). Available at: ibm.co/2gN291W. Accessed December 6, 2016.
- McKinsey & Company, “How big data can revolutionize pharmaceutical R&D”, (2013). Available at: bit.ly/1T2oNhW. Accessed December 6, 2016.
- Stephen Jay Gould, “The Median Isn’t the Message, Discover”, Discover, June (1985). Available at: bit.ly/2hoxh6d. Accessed December 12, 2016.
- R Fisher, “The Arrangement of Field Experiments”, Journal of the Ministry of Agriculture of Great Britain, 33, 503–513 (1926).
- R Koselka, “The New Mantra: MVT”, Forbes, 11, 114-118 (1996).
Jasmine is a Principal Scientist, Quality by Design, at Dr. Reddy’s Laboratories SA


