Not Spoiling the (Biopharma) Broth
Can sophisticated (spectroscopic) sensors streamline bioprocess monitoring to better meet FDA standards?
Dörte Solle, Philipp Biechele, Christoph Busse and Thomas Scheper |
The ability to measure all process variables is of great importance in the field of bioprocess monitoring, control, documentation and approval. In 2002, the FDA launched a new initiative to promote innovation of process analytical technologies within the pharmaceutical industry. The aim? To create processes that generate products of ensured quality. How? By using effective and suitable sensor systems for measuring quality-related process variables.
Process analytical technology (PAT) has been part of biotechnology, biopharma production, and the food industry for some years, with some of the sensor technologies used for bioprocess monitoring well established and reliable. And yet, despite newer systems being available for bioprocess monitoring, many are still not commonly used – most likely because the implementation of new sensor systems into already approved processes would lead to a time-intensive and expensive re-approval of the process.
Three’s a charm
Most bioprocesses are three-phase systems; the cells are dispersed as a solid phase in a liquid medium phase, which is aerated by a gas phase (1). The interactions among these three phases are complex, and there are several types of variables to consider among these three phases: physical (for example, pressure, temperature), chemical (for example, pH, pO2, nutrients, and metabolites) and biological (for example, biomass concentration, cell morphology). Monitoring and control of physical variables are common during bioprocesses, with chemical variables like pH and pO2 also being established. For nutrients, metabolites and the biological components, however, sensors are either not established or are not available.
Biological components often react very sensitively to environmental changes, sometimes resulting in adverse effects on activity or reproducibility of the process. Detailed analysis and monitoring of the three phases – combined with deep process knowledge – is therefore necessary to control and optimize cultivation processes for high product concentration and quality, as well as for documentation purposes.
At present, most variables are monitored off-line by sample taking or by at-line HPLC. Off-line sensors are possible, but less desirable because of infrequent sampling and long response times; without closely following important process dynamics, efficient control of the process is not possible (2). In-line or in-situ sensors are essential in bioprocesses so that the actual state of the bioreactor can be controlled and monitored at all times. However, developing sensors suitable for bioprocesses is a complicated challenge, because sensors interfaced directly with a bioreactor must be robust enough for the harsh condition of sterilization, and must not be affected by fouling or by interference with the medium. Subsequently, not all analytical tools from the laboratory are suitable for in-line monitoring of bioprocesses in an industrial environment.
State-of-the-art tech
In bioprocesses, changes in the concentrations of several gases, especially oxygen and carbon dioxide, provide information about cell growth, metabolism, and productivity, and can be monitored by off-gas analytics – very common in bacterial and yeast cultivations.
The concentrations of dissolved gases, including oxygen and carbon dioxide, as well as various nutrients, metabolites and products, need to be monitored in the liquid phase. Classical electro-chemical sensors can be used for pH, pCO2 and pO2 measurements in steel bioreactors, using standard ports. For disposable bioreactors, optical chemosensor systems – also called optodes – can be used for those variables. Optodes are based on the interaction of a matrix-embedded indicator and the analyte (3) and can be pre-sterilized within the disposable containers by γ-radiation and can be connected to optical fibers via transparent materials, such as glass. Such optical chemosensors are used to monitor chemical variables, but for nutrients and other biological variables, spectroscopic measurement is recommended. Common spectroscopic methods for bioprocess monitoring are focused on the spectral range from UV to MIR, including fluorescence and Raman spectroscopy. Various bioprocess variables can be measured in different spectral ranges (4–16) (see Figure 1).
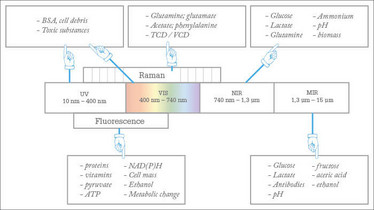
Figure 1: Spectral range for bioprocess monitoring with accessible variables.
There are several advantages to using spectroscopic sensors. No sampling is needed (except for calibration), there is no interaction between the sensor and analytes, and several different process variables can be determined simultaneously. However, chemometric data analysis is required for spectroscopic bioprocess monitoring to extract relevant process information.
The most important variable in bioprocesses is the biomass – the solid phase in the complex, three-phase system. The biomass can be characterized by its concentration or by its metabolic activity, and different analytical methods exist to determine both of these. The measurement of the optical density (OD) by turbidity is one of the most frequently applied technologies for biomass monitoring, but impedance measurements can also provide metabolic information about culture condition. And through so-called in situ microscopy (ISM) – microscopy directly in a bioreactor – it is possible to acquire pictures of the suspended organisms and to analyze the cell concentration, cell size, cell distribution, and morphology automatically by image-processing algorithms (42).
In addition to the biomass, the concentration of viable, metabolically active cells is of special interest in bioprocesses because they are the only ones able to grow and produce the desired product. The determination of bioactivity is possible by certain sensors; for example, turbidity probes allow inferences about cell size and morphology, impedance sensors can be used for the observation of lipid storage in yeast (43), and image analysis by ISM systems makes information on cell size and morphology accessible. However, special systems have been developed specifically to analyze the metabolic activity of cells. The oxygen uptake rate (OUR) is a robust indicator of the determination of cellular activity, and as one of the fundamental physiological characteristics of aerobic culture growth, it has been used frequently for the optimization of bioprocesses (44–46).
Getting on-line
Several sensor technologies provide an enormous amount of data, especially when spectra are generated via in-line sensors at high frequency. The data must be correlated to important process variables, like substrate concentration, or to the actual process status in a calibration model. Afterwards, the model can be used to predict the variables or the process status from on-line spectroscopic data. For these correlations, multivariate data analysis must be applied because the relevant information is distributed over the entire data set and cannot be found in a subset of a spectrum nor in only one spectrum (47, 48). Such chemometric methods are used to provide interpretable information from the enormous amount of spectroscopic data of a bioprocess.
Data pre-processing is a sensitive and powerful tool for spectroscopic data (49), with the method of choice depending upon the spectral data. After data pre-processing, multivariate data analyses are performed to extract qualitative or quantitative process information from the spectral data. Many established applications are based on principal component analysis (PCA), which assesses the main components of spectral variance induced by changes during the process. With PCA, a classification of raw materials, batches, or the process status is possible (50).
All of these qualitative methods can be used to monitor a bioprocess as defined by PAT (51), and high process reproducibility and product safety can be provided by this type of process supervision (52). A process target line, or trajectory, can be identified out of similar ideal process runs (53–56), with different measurements, multivariate spectroscopic data, or univariate classical process data being pooled to generate a holistic view of the bioprocess (57).
In contrast to those qualitative methods, quantitative models are needed to describe correlations between single analytes and spectral data. Using PLS, the values of different variables can be predicted from a spectroscopic measurement by chemometric models (58, 59). For a PLS calibration, representative process data are needed – including both spectral data and the corresponding reference values. The data need to be distributed over the entire process, describing the variance inside a single process run as well as different process runs. Both variabilities need to be considered for calibration, in order to calculate a reliable PLS model with satisfying prediction quality to unknown process data (60–63). The process of model construction is sensitive and extensive, but based on this, broad on-line monitoring in terms of the PAT is possible (64–68).
Novel optical sensors are of course among the major developments in bioprocess monitoring, with spectroscopy increasingly being used for determining variables in-line in the liquid phase – and having strong advantages despite the significant requirement for calibration and data treatment via chemometric tools.
Part of the (bio)reactor
If we are to meet the special requirements of these modern single-use reactor systems, we need a new sensor philosophy. Conventional sensors were mostly built as reusable devices for long-term operation, but cannot be inserted directly into single-use bioreactors. In comparison to reusable devices, the lifetimes of such single-use sensors can be shorter, but still must be long enough for long-term, continuous production processes. Furthermore, these sensors must be cheap (owing to their single-use nature), small, and modular (21, 28). Optical sensors and semiconductor devices (for example, ISFETs) are well suited for such purposes (69).
Sensor patches or other measurement systems can be connected with reusable external equipment; therefore, the material of disposable reactor systems must be permeable to the sensor signal; for example, glass windows are a common way of transmitting optical signals from the inner space of the reactor to connected external devices, such as optical fibers and detectors. The observable trend of modern bioprocessing toward single use, disposable systems will help to promote the development of new sensor systems or adapter systems that enable the connection of “classical” sensors to disposable reactors.
Quality first
The FDA specifies that “quality cannot be tested into products; it should be built-in or should be by design”. “Built-in” bioprocess quality is enabled by combining process analysis, process knowledge, and process modeling, with tools like multivariate data analysis, bioprocess modeling, Design of Experiments (DoE), and new sensor technologies to reach defined quality goals and to document the process. The process information generated can provide deeper process knowledge for the safe handling of all quality-related variables; the ability to monitor and control critical process parameters (CPP) is the path towards holistic control. The upshot? Quality can be ensured during all manufacturing steps and makes real-time release of products feasible via process validation.
Optical and spectroscopic sensors meet these requirements, as well as offering the possibility to monitor various compounds simultaneously. The downside is that these sensors require complex data handling via chemometric models to derive valid process information. The variety of such sensors described in research is huge, and transfer to broader applications in industrial biotechnology in the near future seems likely. If the biopharmaceutical industry is committed to a total process overview and the ongoing improvement of processes by on-line monitoring (ultimately aiming to meet the goals of the PAT initiative), modern sensors must be embraced – and further development is inevitable.
Dörte Solle, Philipp Biechele, Christoph Busse, and Thomas Scheper are all based at the Institute of Technical Chemistry, Leibniz University, Hannover, Germany.
- A Bluma et al., “In-situ imaging sensors for bioprocess monitoring: State of the art,” Anal Bioanal Chem 398 (6), 2429–2438 (2010).
- M Pohlscheidt et al., “Bioprocess and fermentation monitoring,” Encycl Ind Biotechnol Bioprocess Biosep Cell Technol (2013).
- C Rehbock et al., “Bioprozessanalytik,” Chemie Ing Tech, 80 (3), 267–286 (2008).
- M Rhiel et al., “Real-time in situ monitoring of freely suspended and immobilized cell cultures based on mid-infrared spectroscopic measurements,” Biotechnol Bioeng, 77 (2) 174–185 (2002).
- M Sandor et al., “Comparative study of non-invasive monitoring via infrared spectroscopy for mammalian cell cultivations,” J Biotechnol, 168 (4), 636–645 (2013).
- CA Sellick et al., “Rapid monitoring of recombinant antibody production by mammalian cell cultures using fourier transform infrared spectroscopy and chemometrics,” Biotechnol Bioeng, 106 (3) 432–442 (2010).
- SA Arnold et al., “In-situ near infrared spectroscopy to monitor key analytes in mammalian cell cultivation,” Biotechnol Bioeng 84 (1), 13–19 (2003).
- G Rao, H Lam, and Y Kostov, “Optical Instrumentation for Bioprocess Monitoring,” in Optical Sensor Systems in Biotechnology, 116, 125–142 (Springer Berlin Heidelberg, 2010).
- Y R Matthieu Clavaud et al., “Chemometrics and in-line near infrared spectroscopic monitoring of a biopharmaceutical Chinese hamster ovary cell culture: Prediction of multiple cultivation variables,” Talanta, 28–38 (2013).
- L Noui et al., “Development of a high resolution UV spectrophotometer for at-line monitoring of bioprocesses,” Chem Eng Process Process Intensif, 41 (2), 107–114 (2002).
- M-N Pons, S Le Bonté, and O Potier, “Spectral analysis and fingerprinting for biomedia characterisation,” J Biotechnol, 113 (1–3), 211–230 (2004).
- LNM Duysens and J Amesz, “Fluorescence spectrophotometry of reduced phosphopyridine nucleotide in intact cells in the near-ultraviolet and visible region,” Biochim. Biophys. Acta, 24, 19–26, 1957.
- K Hantelmann et al., “Two-dimensional fluorescence spectroscopy: A novel approach for controlling fed-batch cultivations,” J. Biotechnol., 121 (3), 410–417 (2006).
- MB Haack, A Eliasson, and L Olsson, “On-line cell mass monitoring of Saccharomyces cerevisiae cultivations by multi-wavelength fluorescence,” J Biotechnol, 114 (1–2, 199–208 (2004.
- HLT Lee et al., “In situ bioprocess monitoring of Escherichia coli bioreactions using Raman spectroscopy,” Vib Spectrosc, 35 (1–2), 131–137 (2004).
- C. Cannizzaro et al., “On-line monitoring of Phaffia rhodozyma fed-batch process with in situ dispersive Raman spectroscopy,” Biotechnol Bioeng, 83 (6), 668–680 (2003).
- D Landgrebe et al., “On-line infrared spectroscopy for bioprocess monitoring,” Appl Microbiol Biotechnol, 88 (1), 11–22 (2010).
- C Haake et al., “Online-Infrarotspektros-kopie in der Bioprozess-analytik,” Chemie-Ingenieur-Technik, 81 (9), 1385–1396 (2009).
- B Sonnleitner, “Automated Measurement and Monitoring of Bioprocesses: Key Elements of the M3C Strategy,” in Measurement, Monitoring, Modelling and Control of Bioprocesses, 1–33 (Springer, 2013).
- P Roychoudhury, LM Harvey, and B McNeil, “The potential of mid infrared spectroscopy (MIRS) for real time bioprocess monitoring,” Anal Chim Acta, 571 (2), 159–166 (2006).
- S. Beutel and S. Henkel, “In situ sensor techniques in modern bioprocess monitoring,” Appl Microbiol Biotechnol, 91 (6), 1493–1505 (2011).
- C Hakemeyer et al., “At-line NIR spectroscopy as effective PAT monitoring technique in Mab cultivations during process development and manufacturing,” Talanta, 90, 12–21 (2012).
- MA Liauw, LC Baylor, and PE O’Rourke, “UV-Visible Spectroscopy for On-Line Analysis,” in Process Analytical Technology, 81–106 (John Wiley & Sons, Ltd., 2010)
- V Vojinovic, JMS Cabral, and LP Fonseca, “Real-time bioprocess monitoring: Part I: In situ sensors,” Sensors Actuators B Chem., 114 (2), 1083–1091 (2006).
- B Tartakovsky et al., “Application of scanning fluorometry for monitoring of a fermentation process,” Biotechnol Prog, 12 (1), 126–131, 1996.
- KD Anders et al., “Biotechnological applications of fiber-optic sensing: multiple uses of a fiber-optic fluorimeter,” Sensors Actuators B Chem, 11, 395–403, (1993).
- K Sato et al., “On-line measurement of intracellular ATP of Saccharomyces cerevisiae and pyruvate during sake mashing,” J. Biosci. Bioeng., 90 (3), 294–301 (2000).
- R Ulber, J-G Frerichs, and S Beutel, “Optical sensor systems for bioprocess monitoring,” Anal Bioanal Chem, 376 (3), 342–348 (2003).
- S Marose, C Lindemann, and T Scheper, “Two-Dimensional Fluorescence Spectroscopy: A New Tool for On-Line Bioprocess Monitoring,” Biotechnol Prog, 14 (1), 63–74, (1998).
- J Il Rhee and T-H Kang, “On-line process monitoring and chemometric modeling with 2D fluorescence spectra obtained in recombinant E. coli fermentations,” Process Biochem, 42 (7), 1124–1134 (2007).
- D Boehl et al., “Chemometric modelling with two-dimensional fluorescence data for Claviceps purpurea bioprocess characterization,” J Biotechnol, 105 (1–2, 179–188 (2003).
- T Becker et al., “Future Aspects of Bioprocess Monitoring,” White Biotechnol, 105, 249–293 (2007).
- T Vankeirsbilck et al., “Applications of Raman spectroscopy in pharmaceutical analysis,” TrAC Trends Anal. Chem., 21 (12), 869–877 (2002).
- NR Abu-Absi et al., “Real time monitoring of multiple parameters in mammalian cell culture bioreactors using an in-line Raman spectroscopy probe,” Biotechnol Bioeng, 108 (5), 1215–1221 (2011).
- LG Tensmeyer and MA Heathman, “Analytical applications of Raman spectroscopy in the pharmaceutical field,” TrAC Trends Anal Chem, 8 (1), 19–24, (1989).
- J Whelan, S Craven, and B Glennon, “In situ Raman spectroscopy for simultaneous monitoring of multiple process parameters in mammalian cell culture bioreactors,” Biotechnol Prog, 28 (5), 1355–1362 (2012).
- J Moretto et al., “Process Raman Spectroscopy for In-Line CHO Cell Culture Monitoring,” Am Pharm Rev, 14 (3), p. 18 (2011).
- F Lottspeich and JW Engels, Bioanalytik Spektrum Akademischer Verlag (2006).
- J Carvell and J Dowd, “On-line Measurements and Control of Viable Cell Density in Cell Culture Manufacturing Processes using Radio-frequency Impedance,” Cytotechnology, 50 (1–3), 35–48 (2006).
- SM Palmer and ER Kunji, “Online monitoring of biomass accumulation in recombinant yeast cultures,” Methods Mol Biol, 866, 165–179 (2012).
- RM Bill, “Recombinant Protein Production in Yeast: Methods and Protocols,” Methods Mol Biol (2012).
- PK Björnsen, “Automatic Determination of Bacterioplankton Biomass by Image Analysis,” Appl Environ Microbiol, 51 (6), 1199–1204, (1986).
- T Maskow et al., “On-line monitoring of lipid storage in yeasts using impedance spectroscopy,” J Biotechnol, 135 (1), 64–70 (2008).
- F Garcia-Ochoa and E Gomez, “Bioreactor scale-up and oxygen transfer rate in microbial processes: An overview,” Biotechnol Adv, 27 (2), 153–176 (2009).
- L Palomares and O Ramirez, “The effect of dissolved oxygen tension and the utility of oxygen uptake rate in insect cell culture,” Cytotechnology, 22 (1–3), 225–237, (1996).
- X Zou, et al., “Oxygen uptake rate optimization with nitrogen regulation for erythromycin production and scale-up from 50 L to 372 m3 scale,” Bioresour Technol, 100 (3), 1406–1412 (2009).
- P Geladi, “Chemometrics in spectroscopy. Part 1. Classical chemometrics,” Spectrochim Acta Part B 58, 58 (5), 767–782 (2003).
- AS Rathore, N Bhushan, and S Hadpe, “Chemometrics applications in biotech processes: a review,” Biotechnol Prog, 27 (2), 307–315 (2011).
- ND Lourenço et al., “Bioreactor monitoring with spectroscopy and chemometrics: a review,” Anal Bioanal Chem, 404 (4), 1211–1237 (2012).
- M Defernez and EK Kemsley, “The use and misuse of chemometrics for treating classification problems ,” Trends Anal Chem, 16 (4), 216–221, 1997.
- SC Potumarthi, “Chemometrics-Based Process Analytical Technology (PAT) Tools: Applications and Adaptation in Pharmaceutical and Biopharmaceutical Industries,” Appl Biochem Biotechnol, 169 (1), 66–76 (2013).
- J Alves-Rausch et al., “Real time in-line monitoring of large scale Bacillus fermentations with near-infrared spectroscopy,” J Biotechnol, 189, 120–128 (2014).
- W Waldraff, R King, and ED Gilles, “Optimal feeding strategies by adaptive mesh selection for fed-batch bioprocesses,” Bioprocess Eng, 17 (4), 221–227, 1997.
- M Navrátil, C Cimander, and C-F Mandenius, “On-line multisensor monitoring of yogurt and filmjölk fermentations on production scale,” J Agric. Food Chem., 52 (3), 415–420 (2004).
- AE Cervera, et al., “Application of Near-Infrared Spectroscopy for Monitoring and Control of Cell Culture and Fermentation,” Am Inst Chem Eng, 25 (6), 2009.
- Y Roggo et al., “A review of near infrared spectroscopy and chemometrics in pharmaceutical technologies,” J Pharm Biomed Anal, 44 (3) SPEC. ISS., 683–700 (2007.
- KJ Clementschitsch Franz, F Pötschacher and K Bayer, “Sensor combination and chemometric modelling for improved process monitoring in recombinant E. coli fed-batch cultivations,” J Biotechnol, 120 (2), 183–196 (2005.
- M Clavaud et al., “Chemometrics and in-line near infrared spectroscopic monitoring of a biopharmaceutical Chinese hamster ovary cell culture: prediction of multiple cultivation variables,” Talanta, 111, 28–38 (2013.
- P Roychoudhury, LM Harvey, and B McNeil, “At-line monitoring of ammonium, glucose, methyl oleate and biomass in a complex antibiotic fermentation process using attenuated total reflectance-mid-infrared (ATR-MIR) spectroscopy,” Anal Chim Acta, 561 (1–2), 218–224 (2006).
- D Solle et al., “Chemometric modelling based on 2D-flourescence spectra without a calibration measurement,” Bioinformatics, 19 (2), 173–177 (2003).
- PK Ghosh and DS Jayas, “Use of spectroscopic data for automation in food processing industry,” Sens. Instrumen Food Qual, 3 (1), 3–11 (2009).
- C Koch et al., “Multi-analyte quantification in bioprocesses by Fourier-transform-infrared spectroscopy by partial least squares regression and multivariate curve resolution,” Anal Chim Acta 807, 103–110 (2014).
- M Milligan et al., “Semisynthetic model calibration for monitoring glucose in mammalian cell culture with in situ near infrared spectroscopy,” Biotechnol Bioeng, 111 (5), 896–903 (2014).
- R Isermann, “Advanced Methods of Process Computer Control for Industrial Processes,” Comput Ind, 2 (1), 59–72, (1981).
- M Navratil et al., “On-line multi-analyzer monitoring of biomass, glucose and acetate for growth rate control of a Vibrio cholerae fed-batch cultivation,” J Biotechnol, 115 (1), 67–79 (2005).
- S Gnoth et al., “Process Analytical Technology (PAT): Batch-to-batch reproducibility of fermentation processes by robust process operational design and control,” J Biotechnol, 132 (2), 180–186 (2007).
- JY Kunlun Hu, “Multivariate statistical process control based on multiway locality preserving projections,” J. Process Control, 18 (7–8), 797–807 (2008).
- AP Teixeira et al., “In situ 2D fluorometry and chemometric monitoring of mammalian cell cultures,” Biotechnol Bioeng, 102 (4), 1098–1106 (2009).
- A Glindkamp et al., “Sensors in disposable bioreactors status and trends,” Disposable Bioreactors, Advances in Biochemical Engineering / Biotechnology, 115, 145–169 (Springer Berlin Heidelberg, 2010).
Dörte Solle, Philipp Biechele, Christoph, Busse, and Thomas Scheper are all based at the Institute of Technical Chemistry, Leibniz University, Hannover, Germany.

